Market Review and Outlook – Gulf Times

QNB Group (QNBK), Qatar Islamic Bank (QIBK) and Commercial Bank (CBQK) were the main contributors to the weekly index rise. QNBK and QIBK added 56.71 and 26.10 points to the index, respectively. Further, CBQK put on another 13.05 points.
Traded value during the week increased by 3.1% to reach QR1,629.0mn from QR1,579.6mn in the prior trading week. QNB Group (QNBK) was the top value traded stock during the week with total traded value of QR230.7mn.
Traded volume declined 4.6% to 609.9mn shares compared with 639.6mn shares in the prior trading week. The number of transactions was higher by 3.4% to 63,118 vs 61,040 in the prior week. Masraf Al Rayan (MARK) was the top volume traded stock during the week with total traded volume of 53.4mn shares.
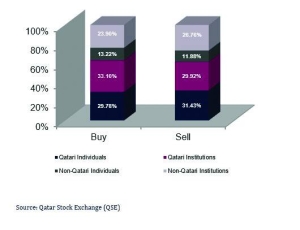
Foreign institutions turned bearish, ending the week with net selling of QR46.6mn vs net buying of QR74.4mn in the prior week. Qatari institutions turned bullish with net buying of QR51.7mn vs net selling of just QR40,550 in the week before. Foreign retail investors ended the week with net buying of QR20.8mn vs net selling of QR24.4mn in the prior week. Qatari retail investors recorded net selling of QR26.0mn vs net selling of QR49.9mn the week before. YTD (as of Thursday’s closing), global foreign institutions were net sellers by $22.8mn, while GCC institutions were net sellers of Qatari stocks by $304.0mn.
The QE Index
The QE Index closed up (+0.7%) for the week; it closed at 10,398.3 points. As expected last week, an uptick seen on the Index inside the broader flat price-range. We expect further travel further north from current levels in the short term. We update our weekly resistance level to the 10,650 points level and the support remains at 9,600 points.
DEFINITIONS OF KEY TERMS USED IN TECHNICAL ANALYSIS
RSI (Relative Strength Index) indicator – RSI is a momentum oscillator that measures the speed and change of price movements. The RSI oscillates between 0 to 100. The index is deemed to be overbought once the RSI approaches the 70 level, indicating that a correction is likely. On the other hand, if the RSI approaches 30, it is an indication that the index may be getting oversold and therefore likely to bounce back.
MACD (Moving Average Convergence Divergence) indicator – The indicator consists of the MACD line and a signal line. The divergence or the convergence of the MACD line with the signal line indicates the strength in the momentum during the uptrend or downtrend, as the case may be. When the MACD crosses the signal line from below and trades above it, it gives a positive indication. The reverse is the situation for a bearish trend.
Candlestick chart – A candlestick chart is a price chart that displays the high, low, open, and close for a security. The ‘body’ of the chart is portion between the open and close price, while the high and low intraday movements form the ‘shadow’. The candlestick may represent any time frame. We use a one-day candlestick chart (every candlestick represents one trading day) in our analysis.
Doji candlestick pattern – A Doji candlestick is formed when a security’s open and close are practically equal. The pattern indicates indecisiveness, and based on preceding price actions and future confirmation, may indicate a bullish or bearish trend reversal.
Shooting Star/Inverted Hammer candlestick patterns – These candlestick patterns have a small real body (open price and close price are near to each other), and a long upper shadow (large intraday movement on the upside). The Shooting Star is a bearish reversal pattern that forms after a rally. The Inverted Hammer looks exactly like a Shooting Star, but forms after a downtrend. Inverted Hammers represent a potential bullish trend reversal.
Disclaimer
This publication has been prepared by QNB Financial Services Co WLL (“QNBFS”) a wholly-owned subsidiary of Qatar National Bank (QPSC). QNBFS is regulated by the Qatar Financial Markets Authority and the Qatar Exchange. Qatar National Bank (QPSC) is regulated by the Qatar Central Bank. This publication expresses the views and opinions of QNBFS at a given time only. It is not an offer, promotion or recommendation to buy or sell securities or other investments, nor is it intended to constitute legal, tax, accounting, or financial advice. Gulf Times and QNBFS accept no liability whatsoever for any direct or indirect losses arising from use of this report. Any investment decision should depend on the individual circumstances of the investor and be based on specifically engaged investment advice. We therefore strongly advise potential investors to seek independent professional advice before making any investment decision.


